Start with SHiNeMaS
User Reference Guide
Part IV: Advanced Features
Prepare & submit a multi-site file with repetitions
Until now we used the preparation tool in a basic way: using filters to establish a list of seed lot, select some of them, filling the form, exporting the list. But we can do a bit better.
Go to the reproduction preparation file interface. First we will filter on location PEM and creation year 2015. We can see all the seeds lot of Peter including the selection he made.
As he wants to evaluate it in 2016, add all the seeds lots to the selected list. Edit your filter parameter and change the location for JOD and search. Add all the seeds lot to the selected list and have a look to the current list. As you can see the seeds lots of JOD are in the list, but also the ones of PEM that you selected just before. That means when you prepare your file, you can use successive queries and filters to refine your list without losing what you already selected.
Now, filter on the location STS. As we said before Steve will sow two repetitions, thus, click a first time on the add all button, and then click a second time. This will simply duplicate the seeds lots in the list. Open the window of selected lots, fill the form with PPB project, split at Yes, sowing year 2015 and harvested year 2016 and export the file. Move the file in the ‘tutorial data’ folder and rename it 07-reproduction_2015-2016.csv. Open this reproduction file and fill the blanks for ‘quantity_sown’ and ‘quantity_harvested’. Use the adapted coordinate for PEM (X=1 and Y=1 to 7) and JOD (X=1 and Y=1 to 6), be careful for STS as the lot are sown in repetitions a same seed lot can’t be at the same location, thus, use X=1 and Y=1 to 6 for the first repetition, and block=2, X=2 and Y=1 to 6 for the second. Note that this is just an example, the only rule is to have different coordinates (X, Y).
As soon as it is done, open the file 07-reproduction_data_2015-2016.csv and copy/past the data in the reproduction file. The method file 07-reproduction_method_2015-2016.csv is ready to use so you can go to the submission form and submit your files. When the submission is done, in the report, choose the ‘open pollinated’ as reproduction type and submit your file with the method file.
Prepare and submit an individual data file with correlation group
We recorded in the database multiple relations on multiple farms, now we will process a similar task for individual data. We will still use the variables ‘height’, ‘ear_weight’ and ‘awns’. We will consider that the ‘height’ and ‘awns’ have been estimated at the field and ‘ear_weight’ out of the field, in the technical room of the farm. Each time on 10 individuals, unfortunately the numbering of individual has been lost between the field and the farm. The numbering is done again but we can’t consider that the measures of the height and awns on the individual labeled ‘1’ at the field are correlated to the ear weight of individual labeled ‘1’ at the technical room. Thus, we will use a concept of correlation groups for the data.
Go to the individual data preparation file interface and use as filter the year 2015 and project PPB. Add all the relations to the list, open the selection window and set 10 individuals, then export the file.
Move the file in the ‘tutorial data’ folder and rename it 08-individual_2015-2016.csv. Open this file and copy/past the data table from 08-individual_data_2015-2016.csv file. Open 08-individual_method_2015-2016.csv containing the methods. As you can see the column ‘correlation group’ is filled with the value ‘A_2016’ or ‘B_2016’. In the 08-individual_2015-2016.csv you will report for each row corresponding to a relation at JDO the value ‘A_2016, B_2016’. That means on a row with correlation groups SHiNeMaS will check t which variables it is related in the method file and assign a correlation group to each data of this for the corresponding variable. All the data of a same correlation group for one individual can be considered as correlated.
Go to the submission form and submit your file with the method file.
Advanced query: measures & generation
The ‘Classic’ query interface provides a tool to display a list of seed lot and information about their origin. You can also with the advanced query tool display complex data tables (‘Measure’ mode) or information about generation of the seed lot (‘Generation’ mode).
Go to the advanced query interface, filter on the creation year 2016, and the cross population ‘RxY’, check ‘Generations’. The table displays 4 seeds lots, the multiplication of PEM, the one of JOD and the two repetitions of STS. This table gives the origin of the lots (how the population has been created, here by a cross), the number of generations overall and on the farm, and the confidence of this information.
On the table below you can see that for all the lots the overall number of generations is 3, that is because they come from the same cross. But, the number of generation on farm is different. On PEM, the number on farm is 3 like the overall. That is obvious, Peter made this cross and reproduced the population on his own farm during 3 years. On the other farms the generation number is 1 because Peter diffused his population after two years of reproductions.
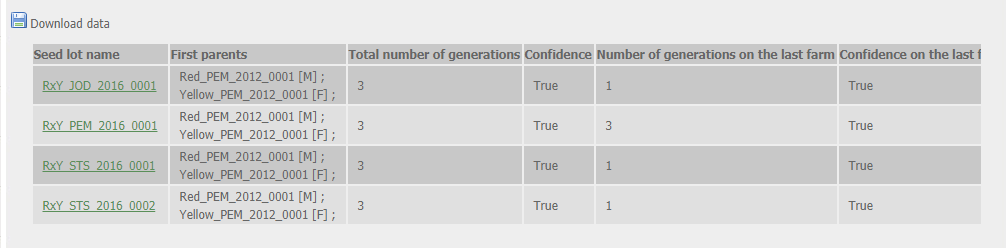
Advanced query (generation mode)
Now, as we saw in previous part, you can display data tables from a relation card, for individual and global data. However, you can’t from relation cards display data for a set of relations. This is what you can do with the advanced query ‘Measures’ mode.
In this example we will display the data of Peter’s multiplication in 2014-2015. Filter on the creation year 2015, location PEM. Check ‘Measures’ mode and fill the range of date: between 2014, September 1st and 2015, July, 1st. Now fill all the variables you use during this tutorial: tkw, sowing_density, sowing_type, height, ear_weight and awns. You get 3 tables aggregating data at different levels (relation or seed lot, global or individual). As usually you can export data tables by clicking on the floppy icon.
Merge repetitions
As we saw previously, Steve decided to sow his lots in two repetitions. After the harvest Steve wish to merge the lots, you can do that with Admin data > Tools > Merge Reps tool.
For each line displayed in the interface select the two seeds lots with the check boxes, select the PPB project, and click on the ‘Merge’ button. A line is displayed informing that the merge has been done with success.
You are ready for the last part of the tutorial !